US Polling Places 2012-2020
Tracking Changes in US Polling Places from 2012 to 2020
Introduction
This project aims to analyze the trends in polling place availability across the United States from 2012 to 2020, with a specific focus on temporal changes and geographic disparities. By examining national and state-level data, as well as differences between urban and rural areas, this project seeks to understand the factors influencing polling place changes and their impact on voter accessibility. Through this analysis, we hope to provide insights that can inform policies to enhance voter access and participation in future elections.
Data Sources
The polling places data used in this presentation originates from “The Center for Public Integrity”.
The dataset was featured in their September 2020 article titled “National data release sheds light on past polling place changes”.
Questions to answer
The two questions we want to answer.
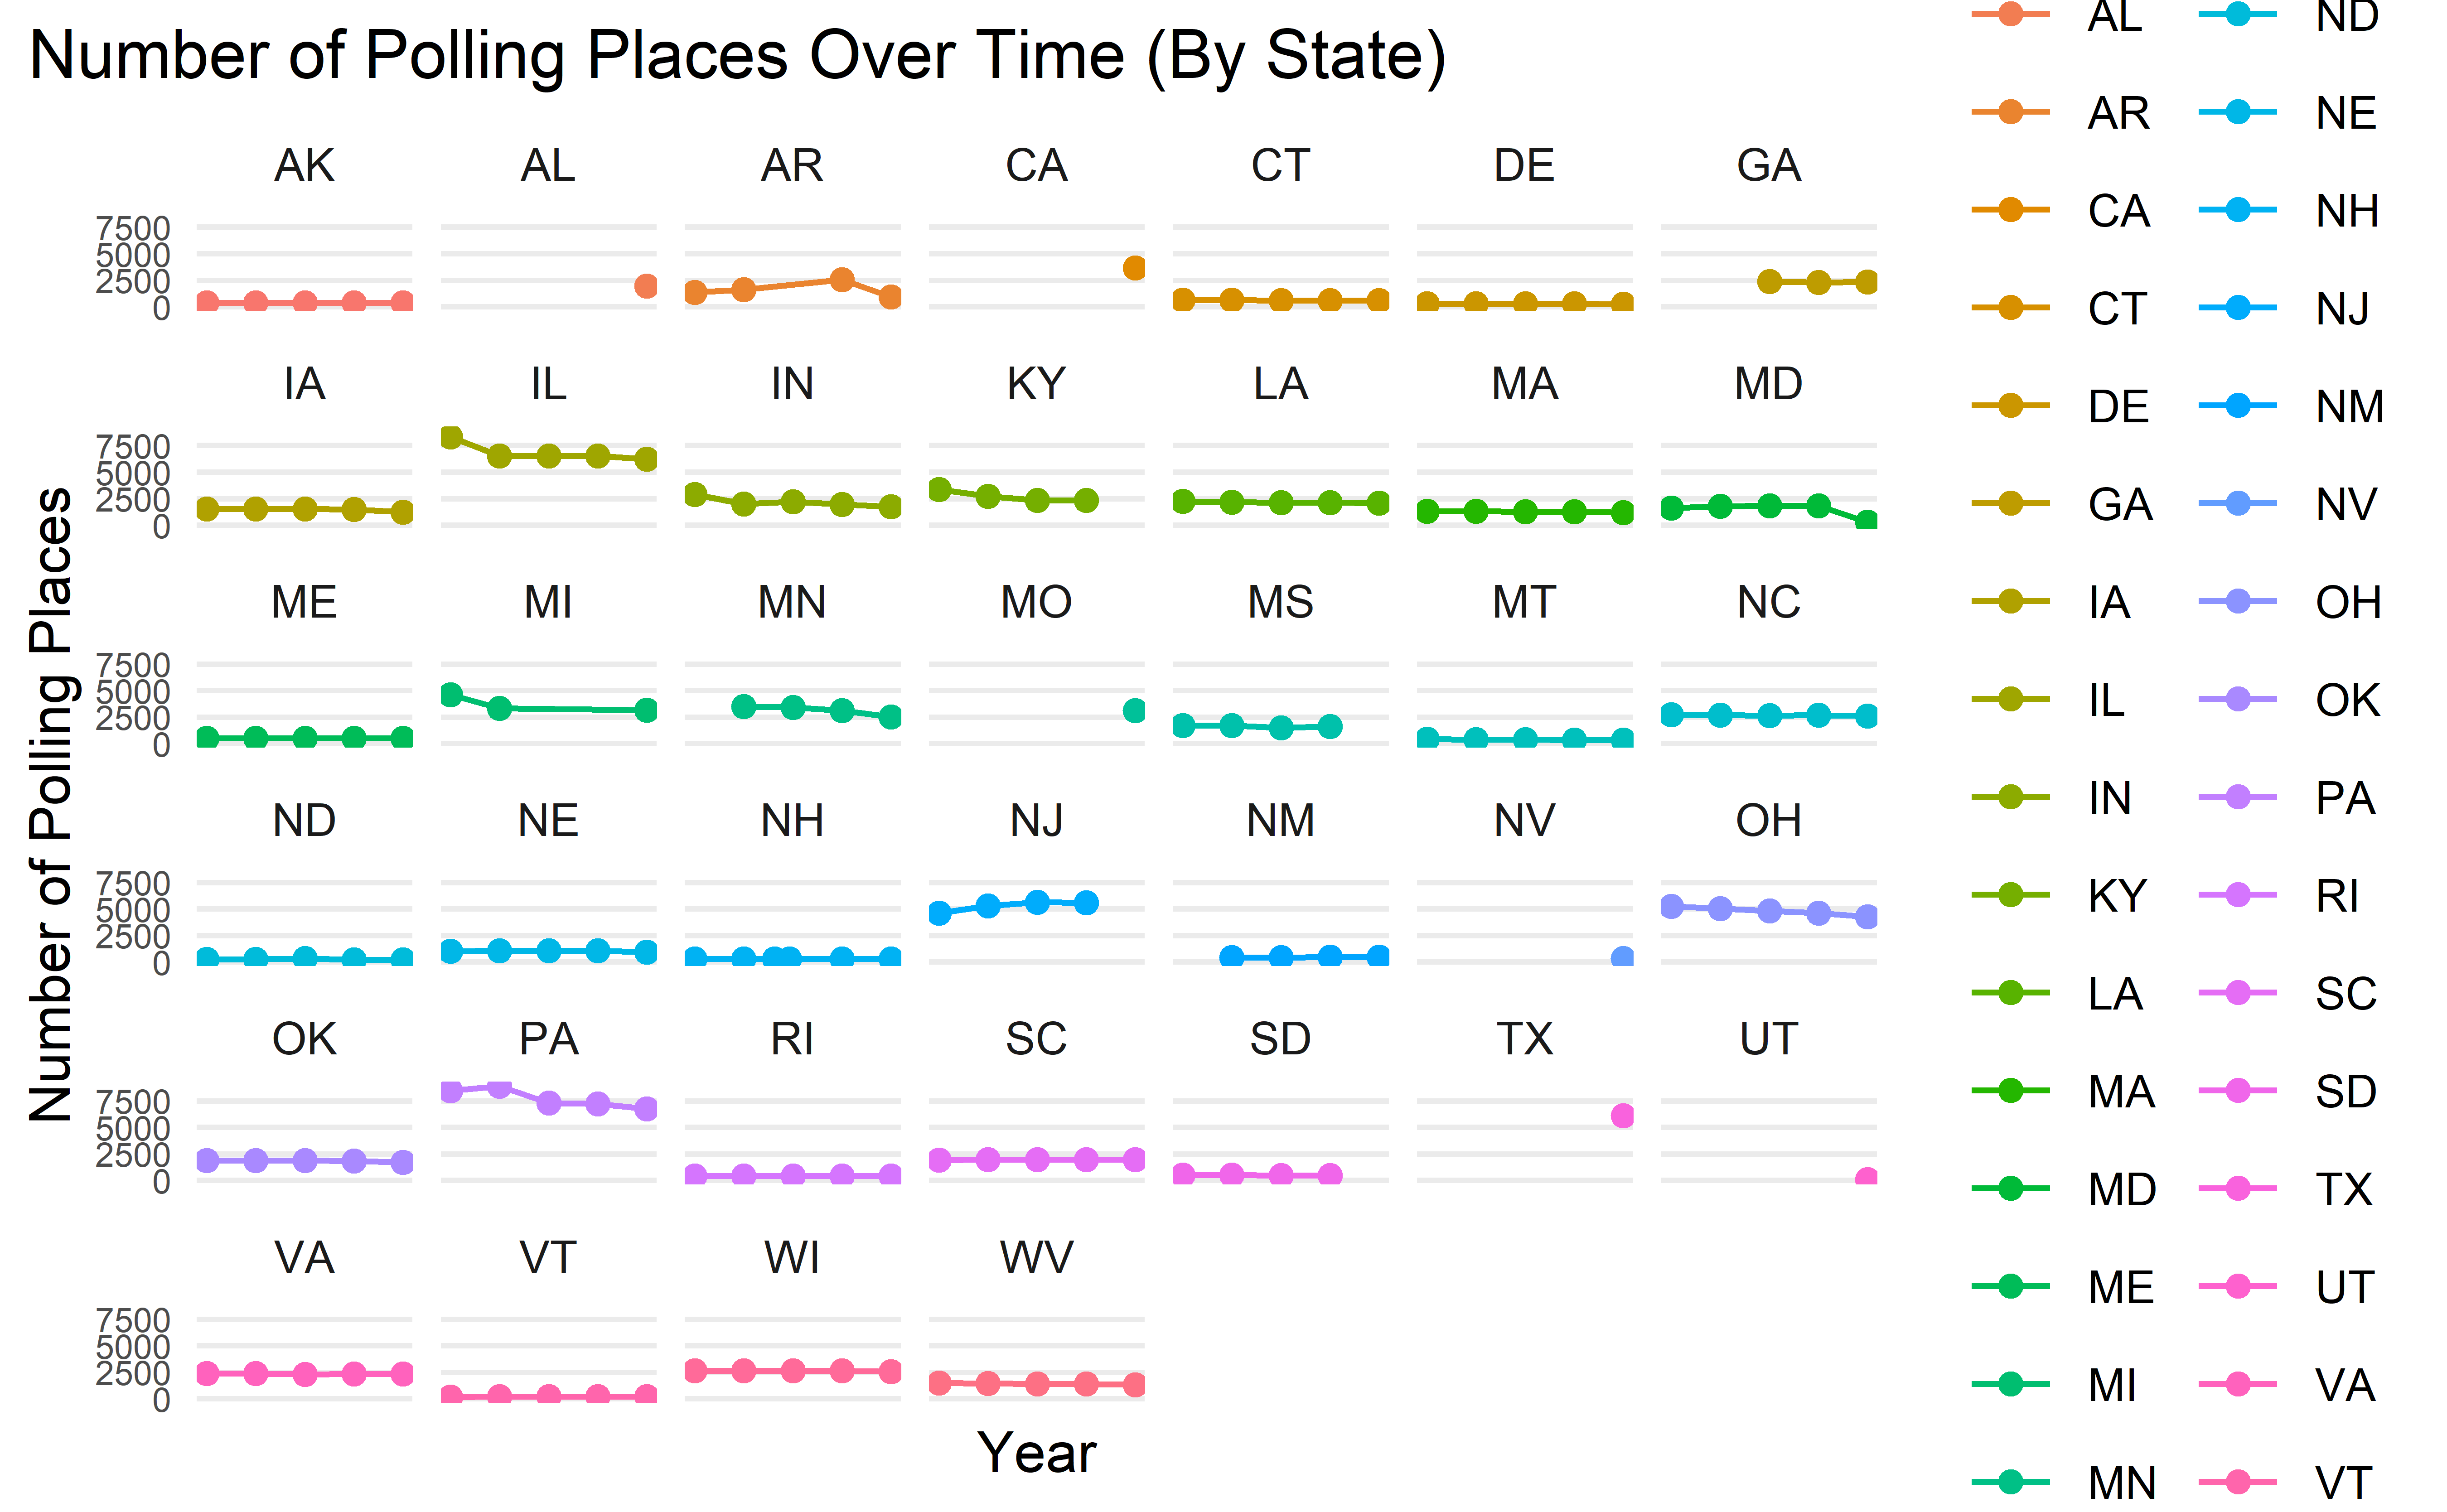
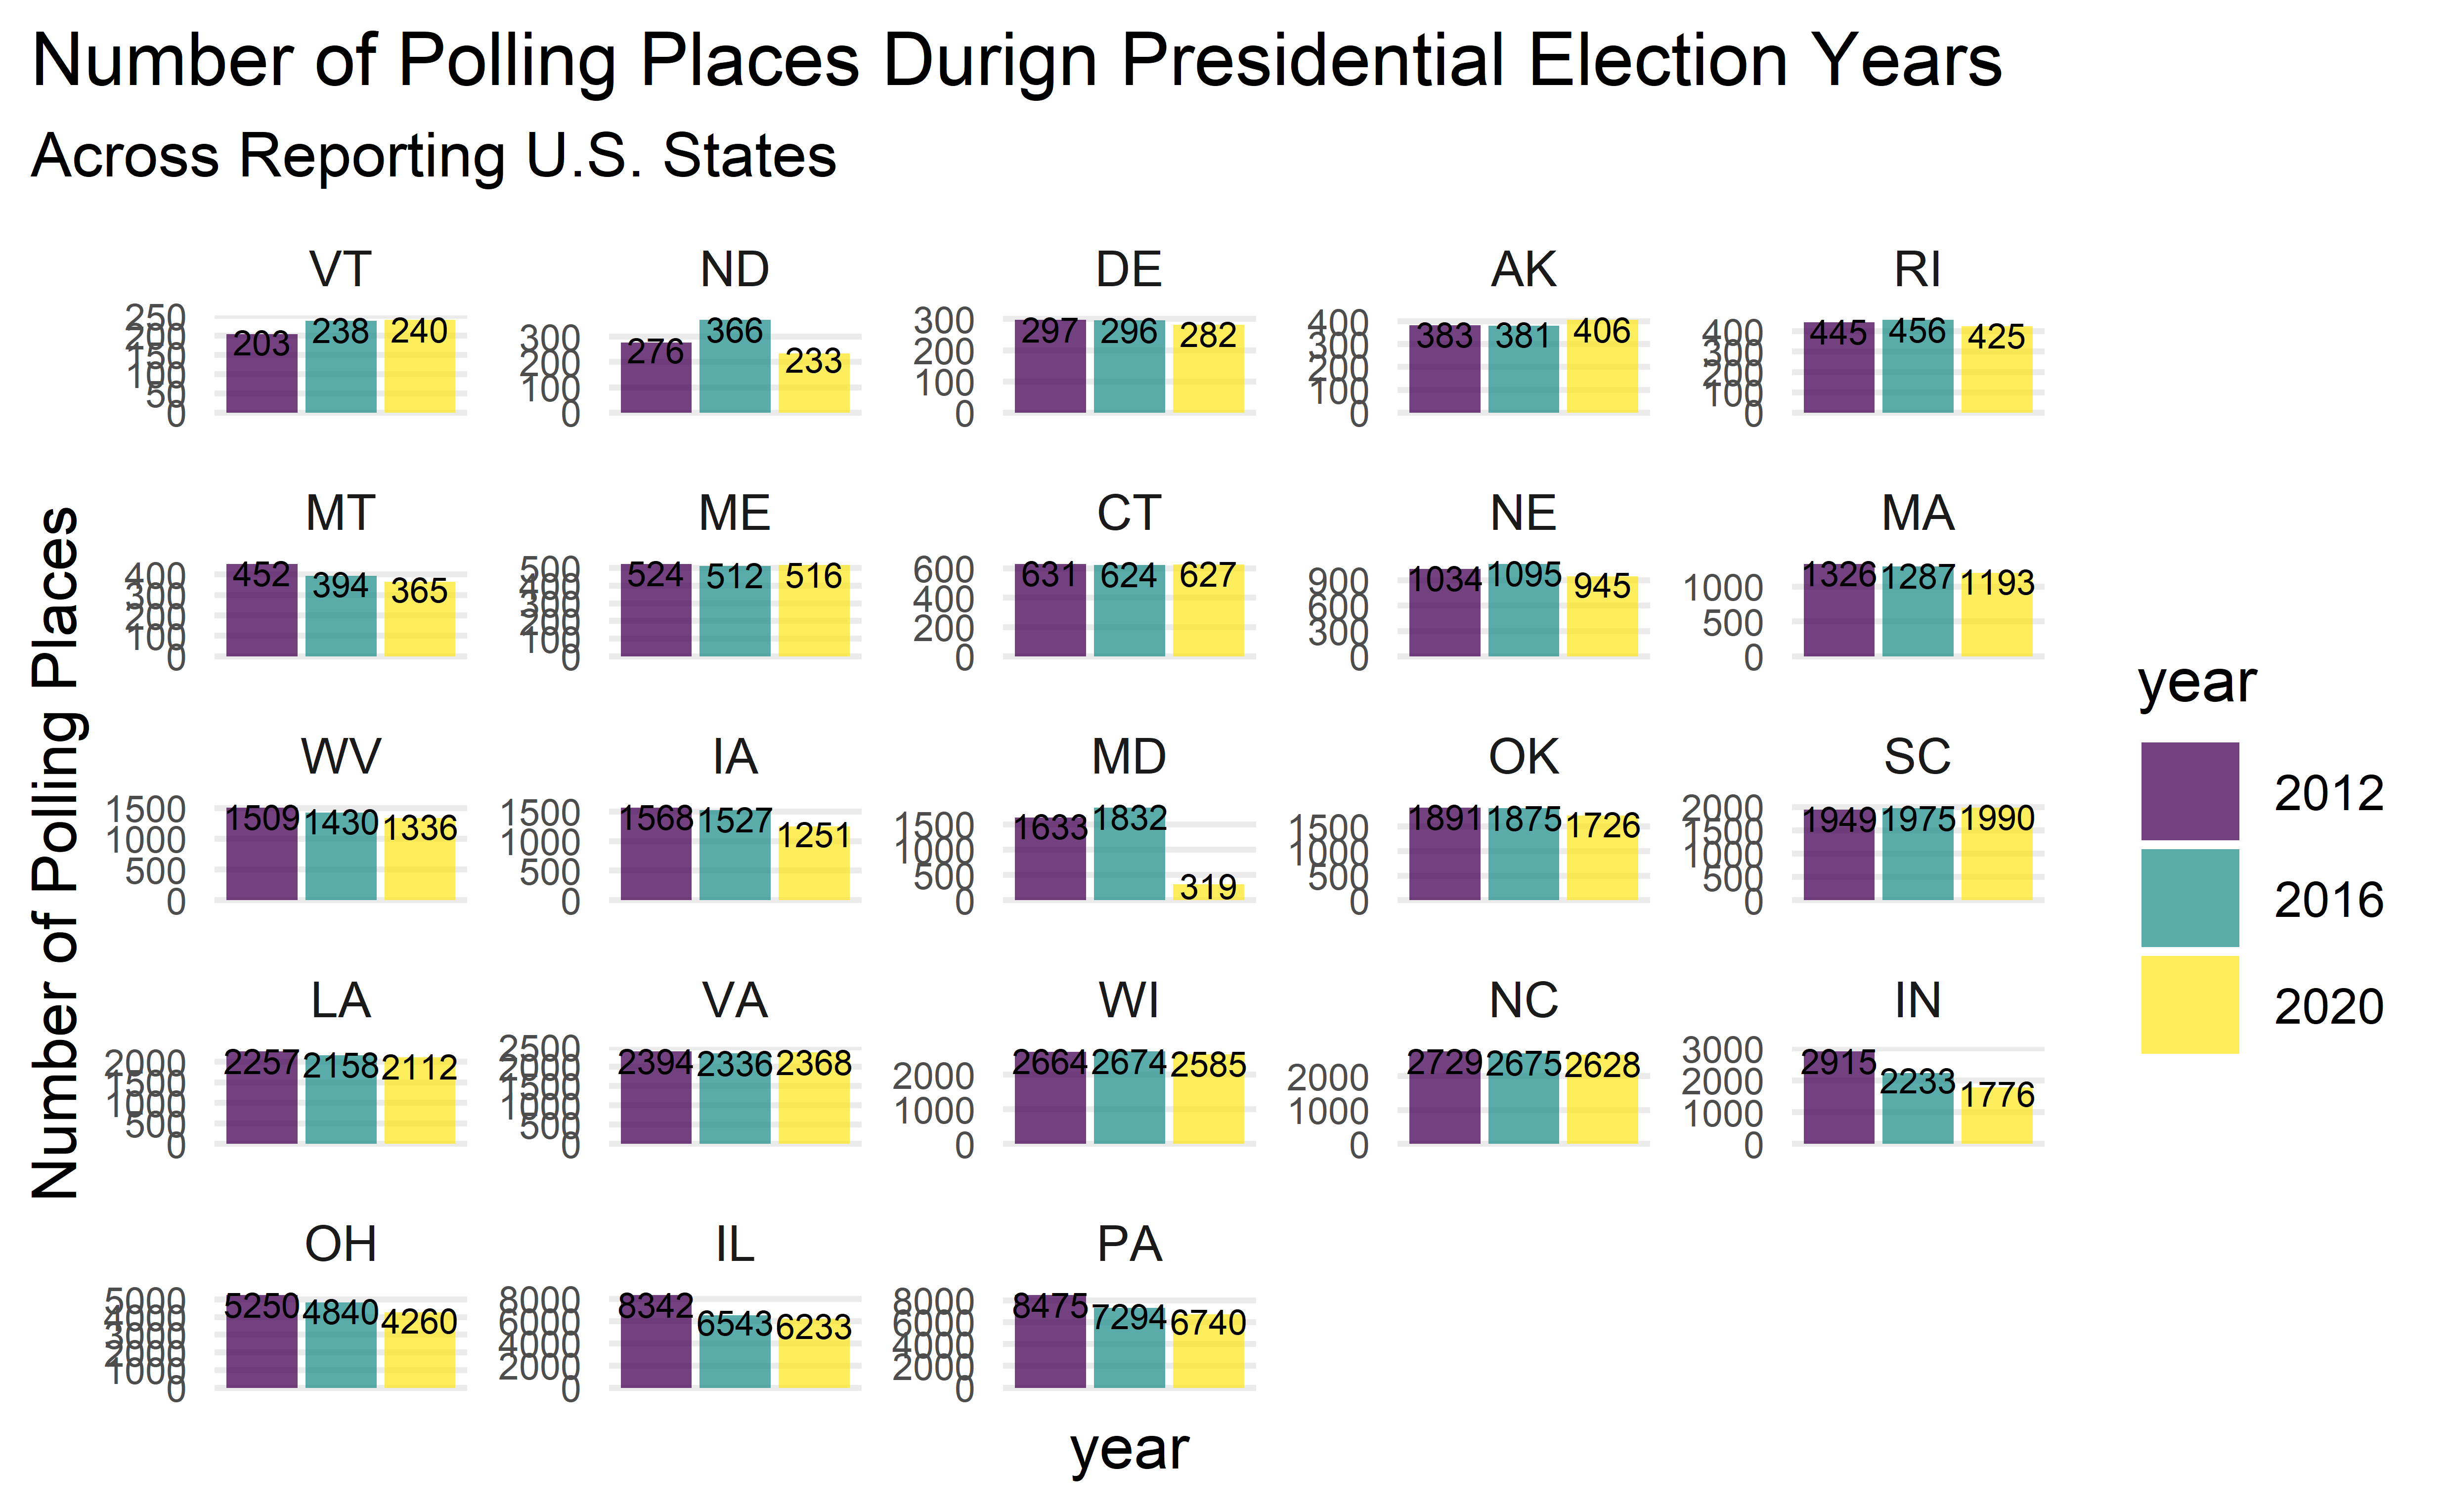
Question 1: What are the trends in the number of polling places over time, both nationally and across different states from 2012 to 2020?
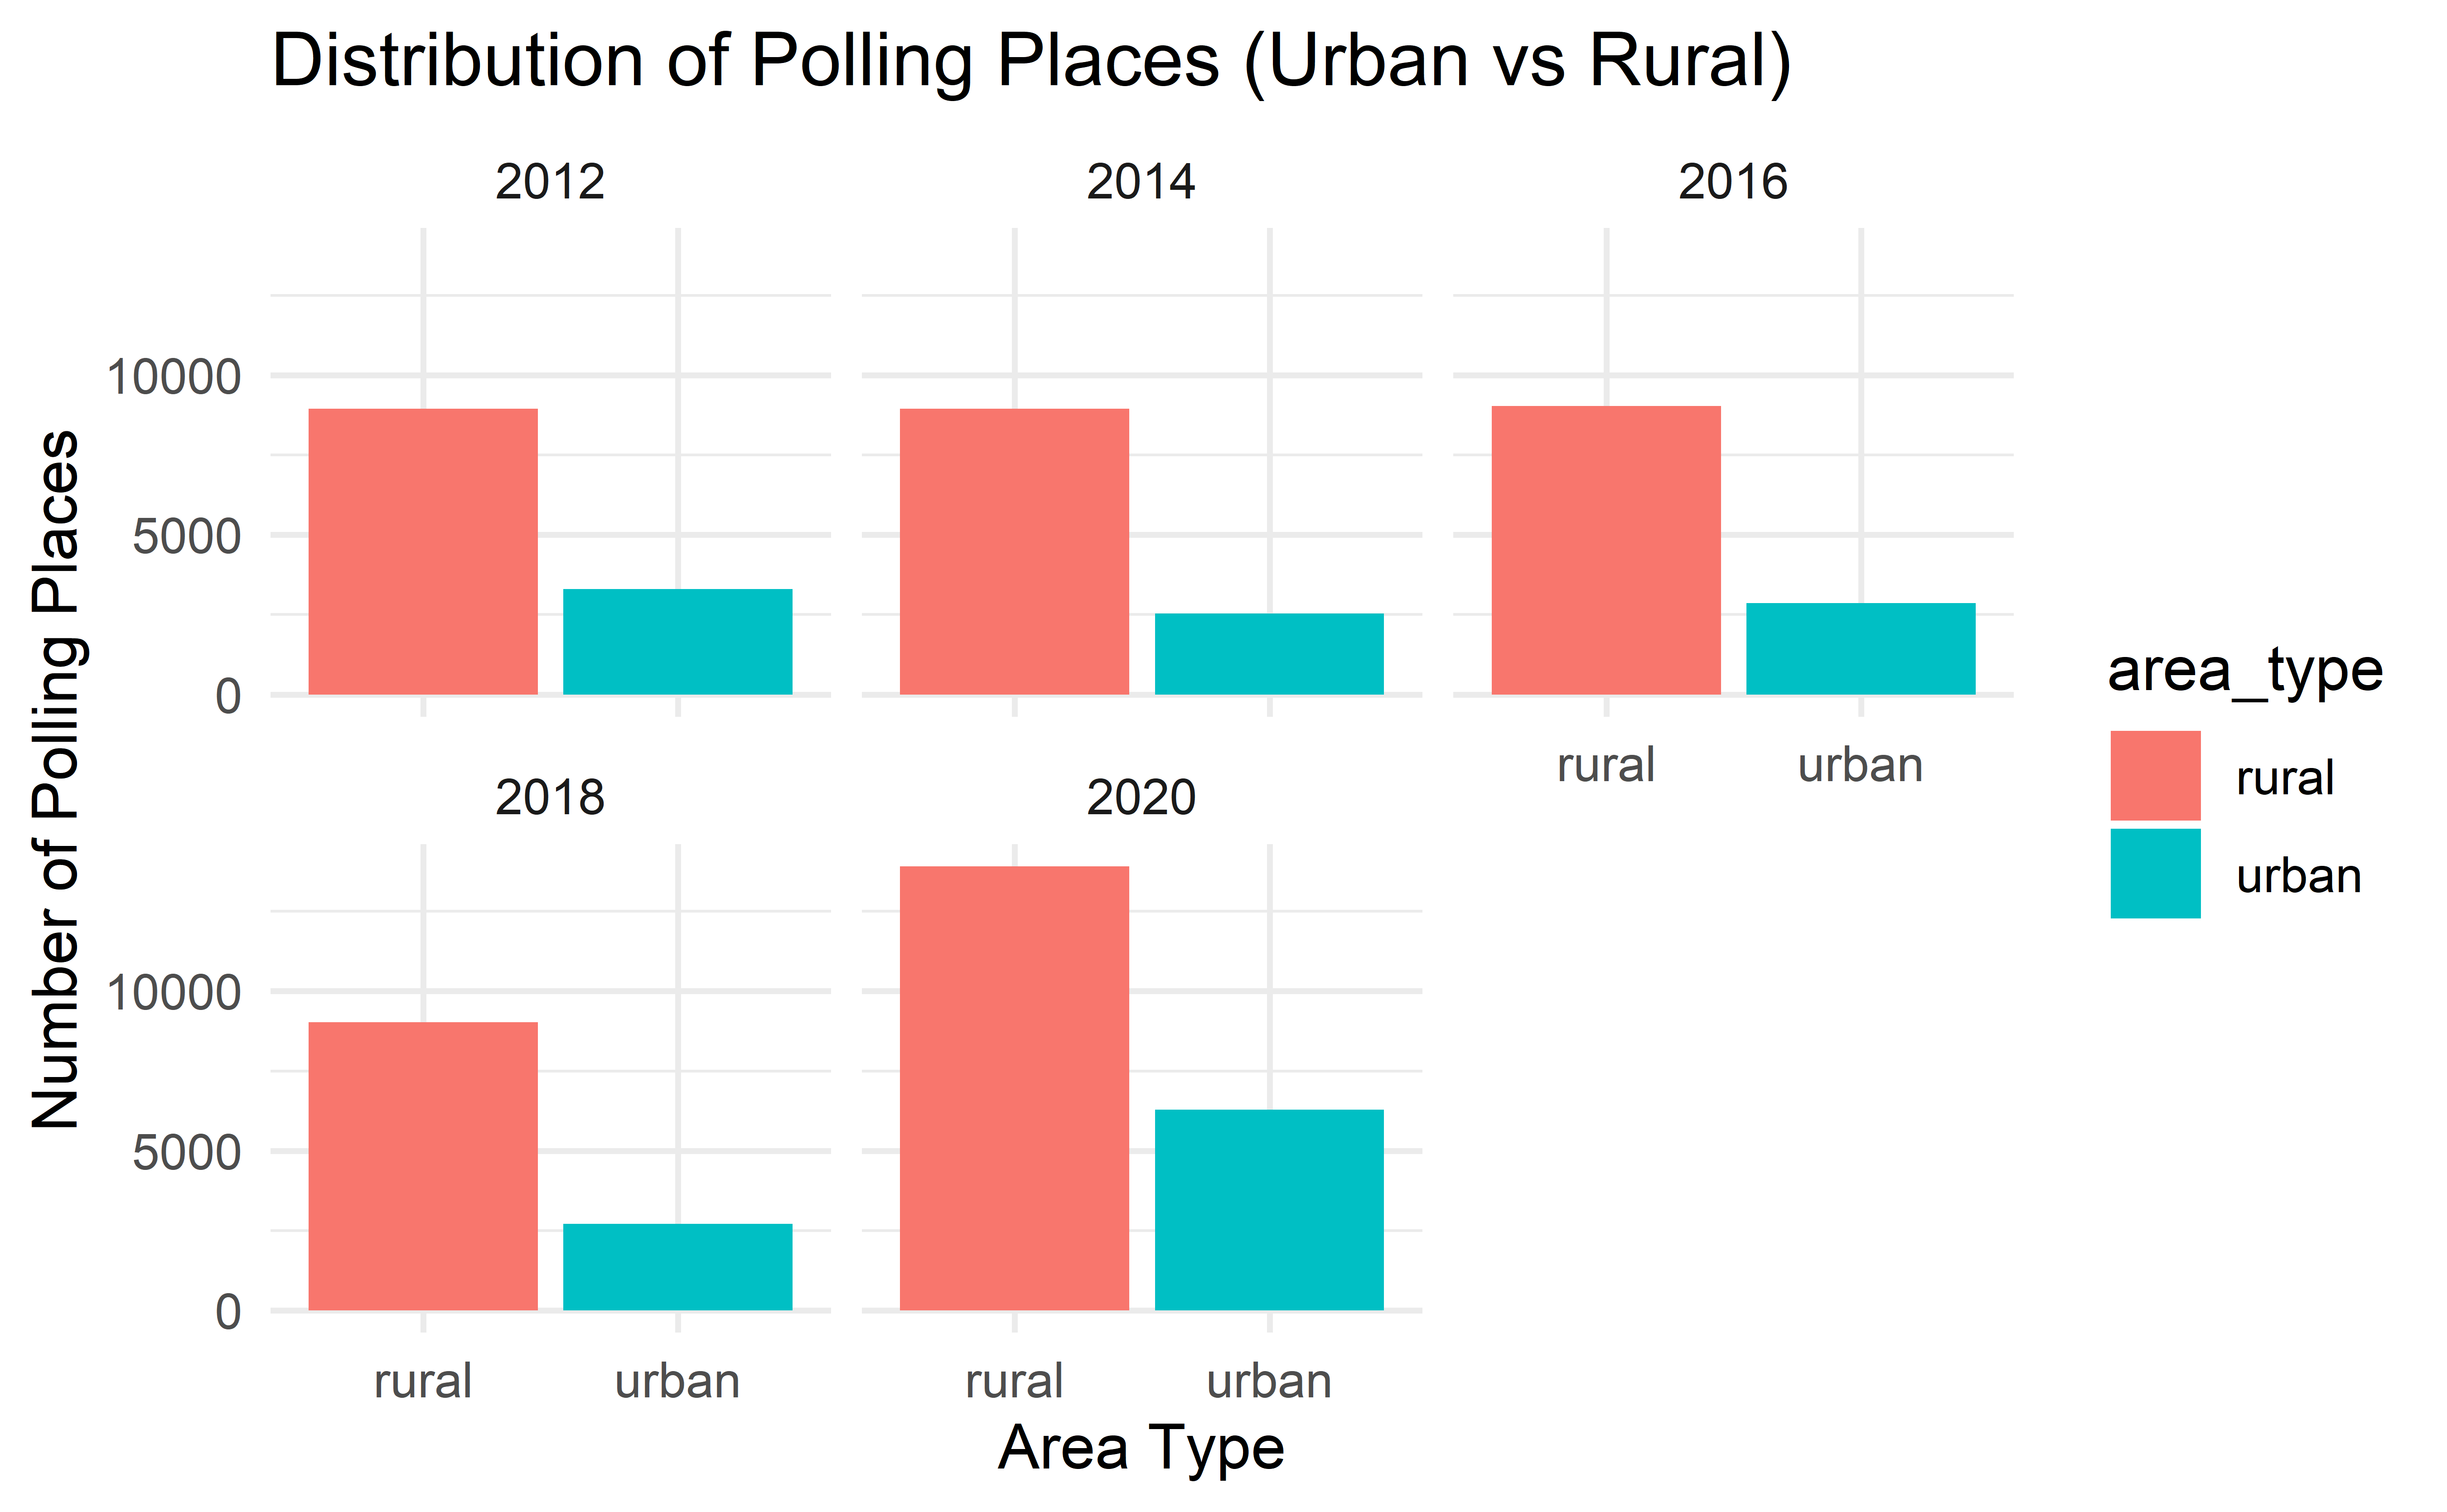
Question 2: How does the availability of polling places vary between urban and rural areas, and what impact does this disparity have on voter turnout?
Question 1
Question 1
Question 2
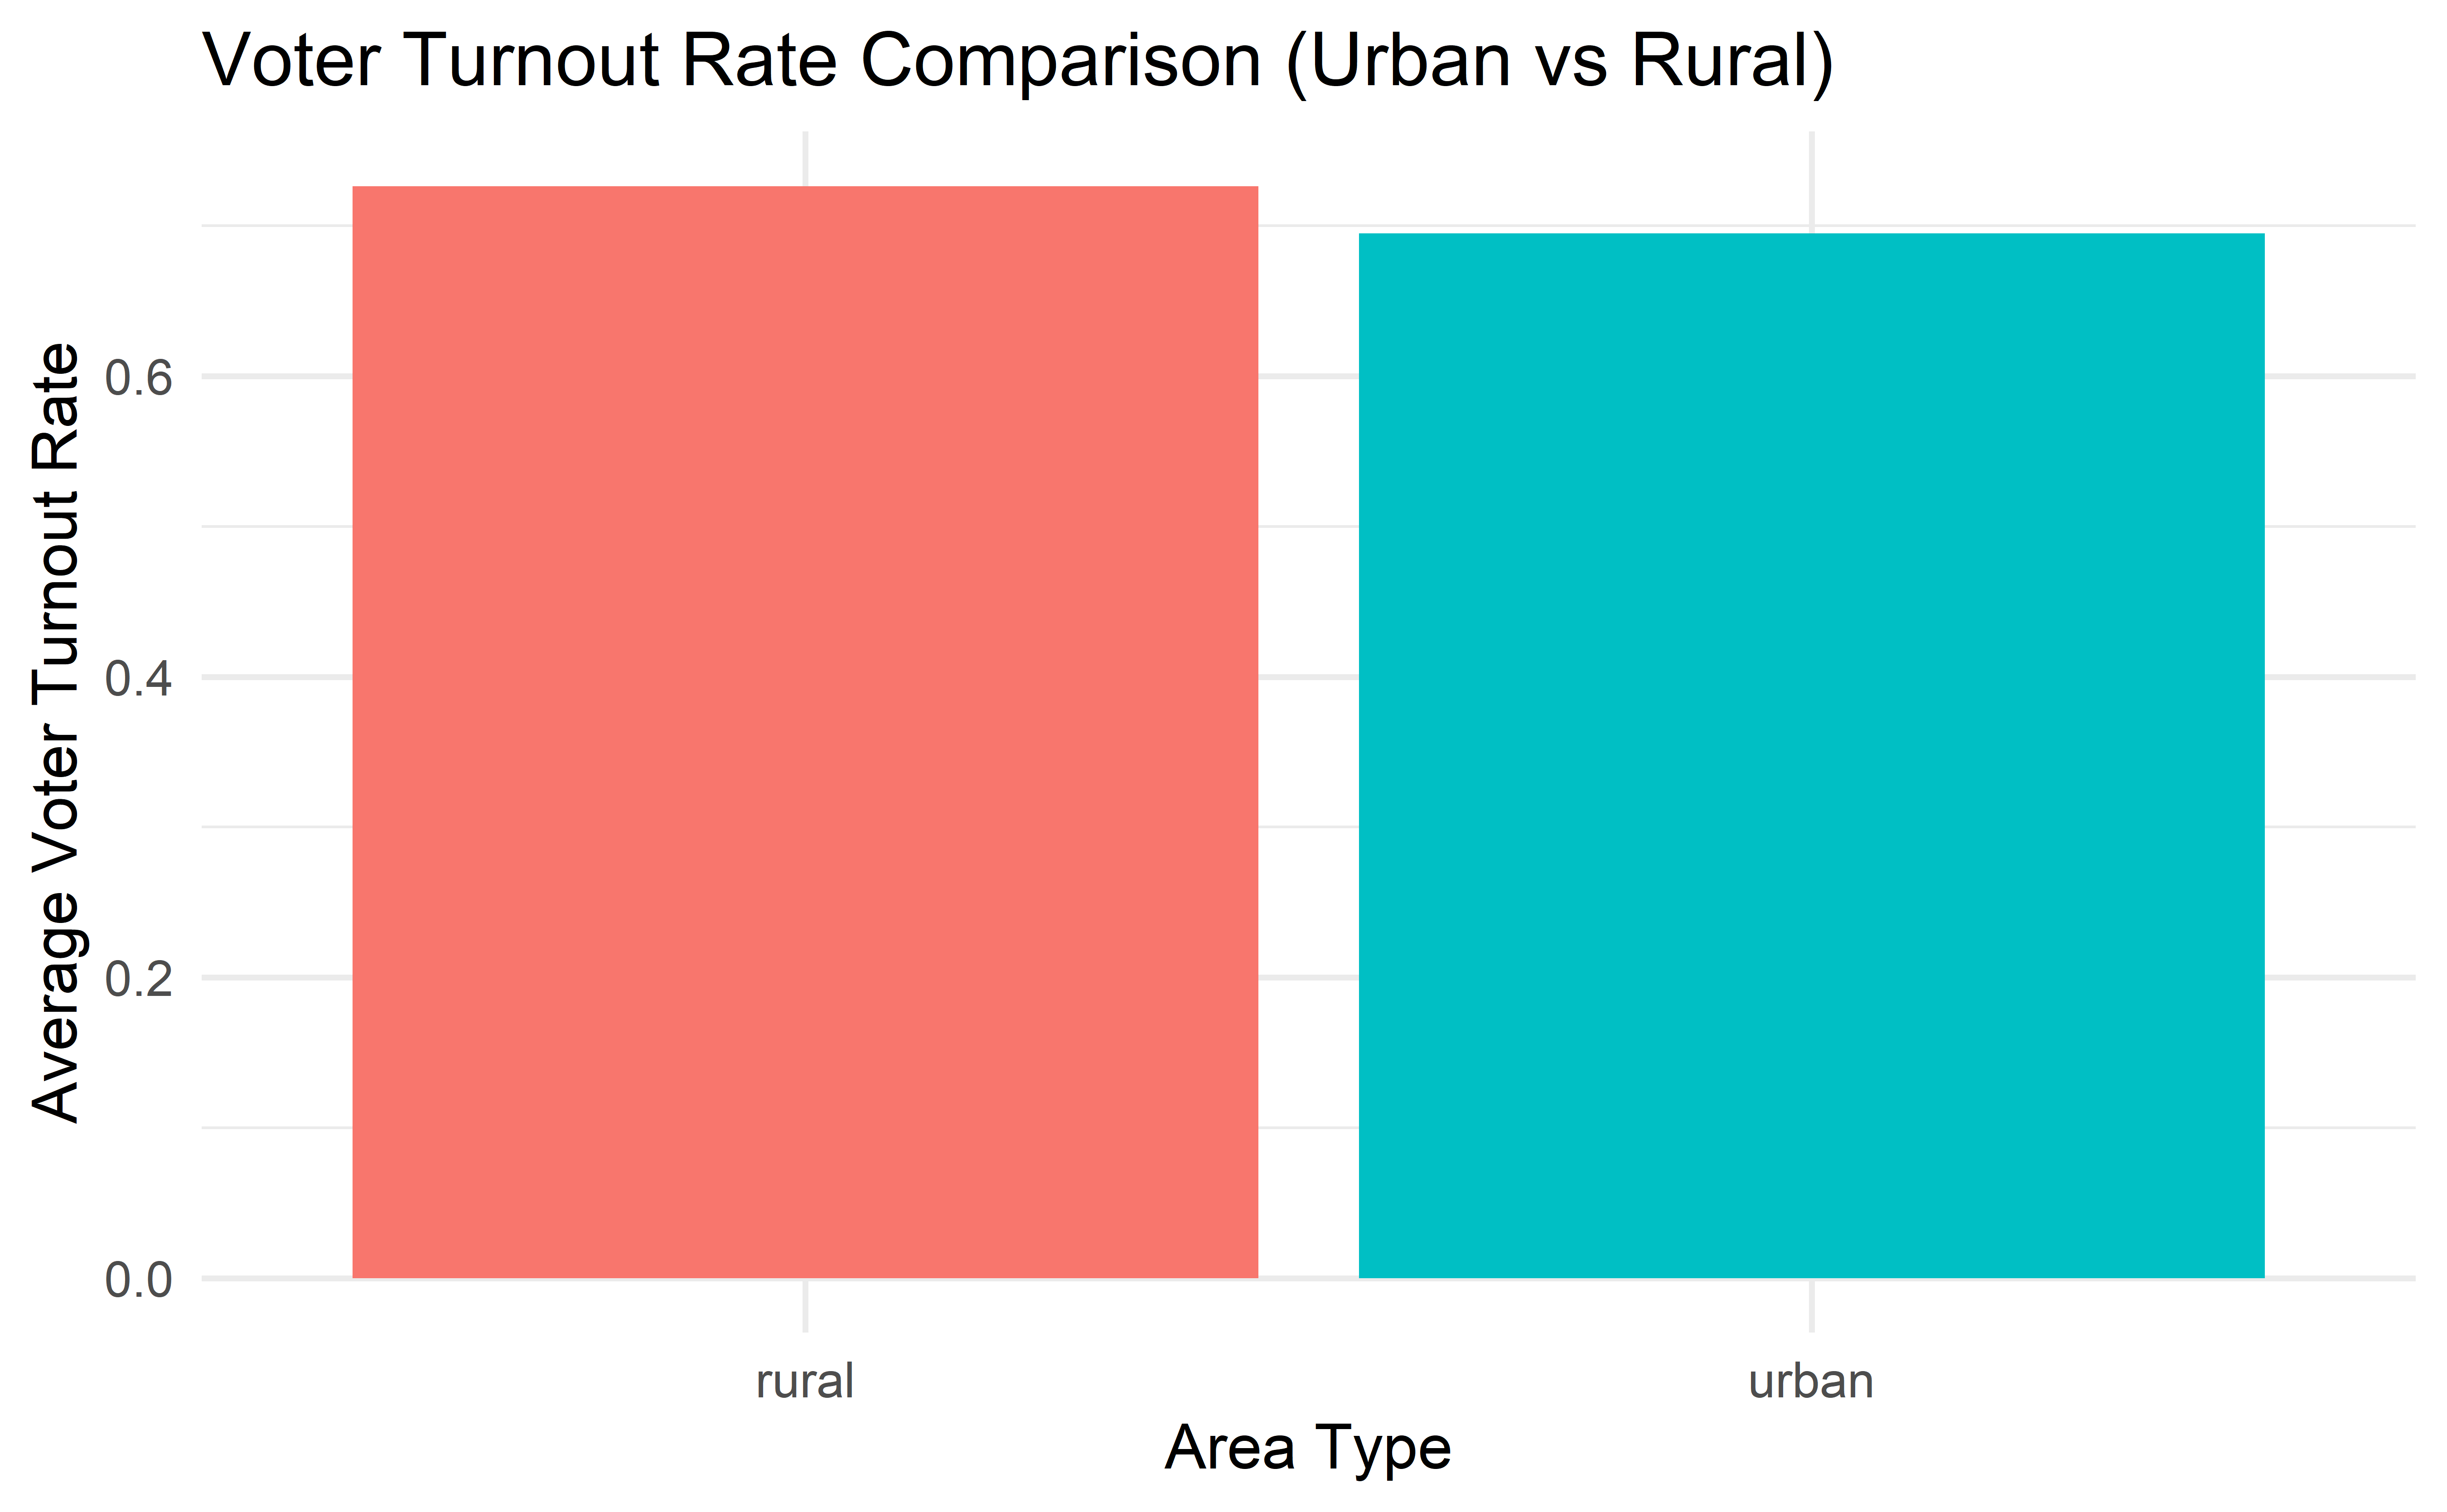
Voter Turnout Rate Comparison
Conclusion
- In question 1 visualization helps us understand how election logistics, such as polling place distribution, have evolved across states from 2012 to 2020.
- In question 2, Our analysis reveals a picture of polling place trends across the United States from 2012 to 2020.
- Rural areas consistently showed a higher concentration of polling places compared to urban areas.
- Specifically, rural areas had slightly higher voter turnout rates, on average, by 3 percentage points compared to urban areas.
Limitations
- Data Limitations: The dataset used may have inconsistencies or missing data that could affect the accuracy of the analysis.
- Assumed Voter Turnout Rate: The fixed voter turnout rate of 65% is an assumption and may not reflect actual turnout rates in different regions and years.
Acknowledgments
- We would like to express sincere thanks to my professor for their invaluable guidance.
- We would like to extend our gratitude to The Center for Public Integrity for providing the polling places data.